

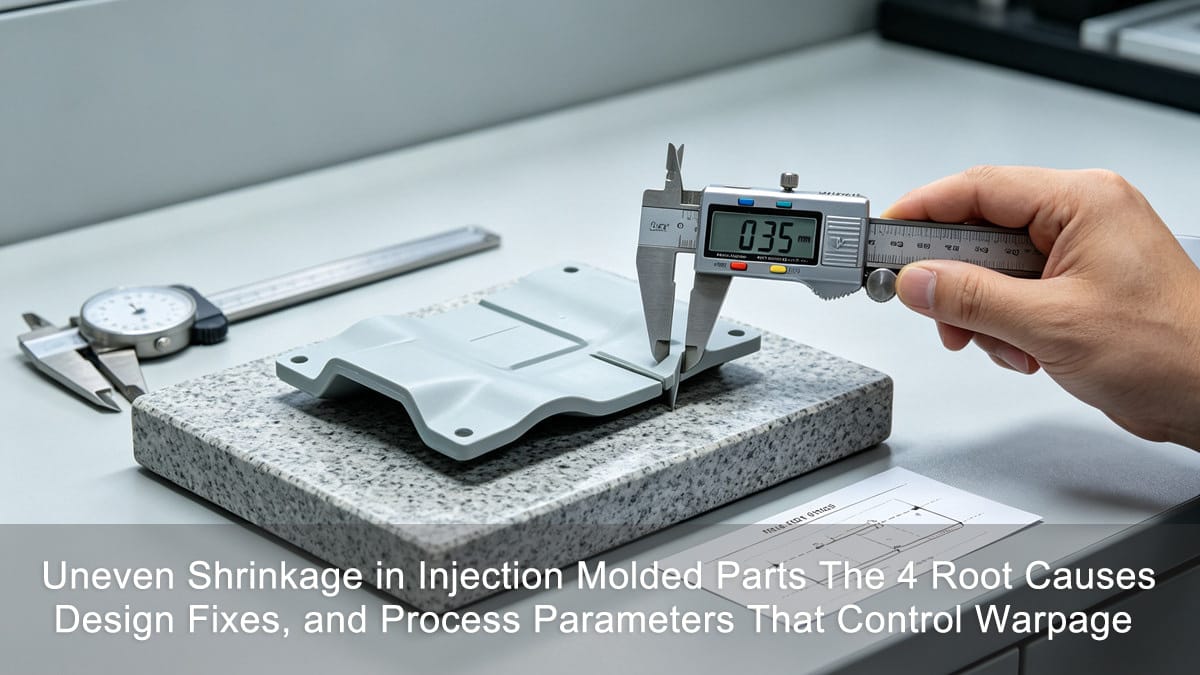
A 96 mm × 64 mm ABS connector cover passed dimensional inspection at the mold trial. Forty-eight hours later, the same part measured 0.42 mm out of flatness on a granite surface plate—well beyond the ±0.15 mm specification. No mold was damaged, no resin lot was changed. The only variable was uneven shrinkage locked into the part during cooling.
In my 15 years troubleshooting warpage across automotive interiors, consumer electronics housings, and medical device enclosures, I have seen this exact pattern hundreds of times: a part that "looks right" at ejection silently accumulates residual stress, then distorts over the next 24–72 hours as that stress relaxes. The root cause is almost never a single factor. It is the interaction of melt temperature gradients, cooling asymmetry, molecular orientation, and wall thickness variation working together.
This article dissects the four primary mechanisms behind uneven shrinkage, maps them to actionable design and process corrections with specific thresholds, and closes with a field case where we reduced flatness deviation from 0.38 mm to 0.06 mm across a 200,000-shot production run.
Key Takeaways
- Cause 1 – Melt temperature gradient: A 10 °C difference in melt temperature across the cavity may increase local shrinkage by 0.3–0.8% for semi-crystalline resins (PA66, POM, PP), directly driving differential contraction.
- Cause 2 – Cooling rate asymmetry: For crystalline polymers, slower cooling allows more time for molecular chain alignment, increasing crystallinity and volumetric shrinkage by 1.5–3.0% compared with fast-cooled regions.
- Cause 3 – Flow-induced orientation: In amorphous resins (ABS, PC, PS), shrinkage along the flow direction is typically 1.2–2.5× higher than transverse to flow, creating predictable warp patterns that can be corrected at the gate location stage.
- Cause 4 – Wall thickness variation: Every 0.5 mm increase in local wall thickness may extend cooling time by 15–25% and reduce packing pressure transmission by 10–20%, creating localized shrinkage hotspots that manifest as sink marks or bow.
Data source: Ideal-Pro 2023–2026 warpage root-cause analysis database (n = 147 molds).
Why Does Uneven Shrinkage Cause Warpage Rather Than Uniform Size Change?
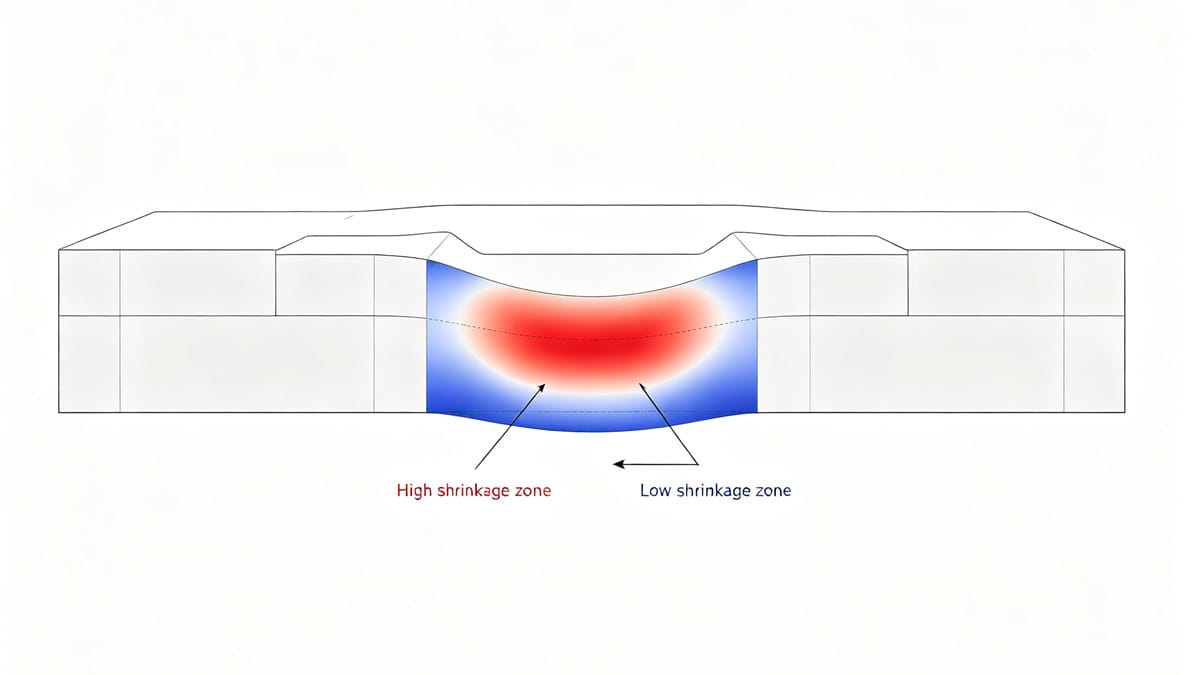
If a part shrank uniformly in all directions, the result would simply be a slightly smaller part—dimensionally different from the mold cavity, but flat and functional. Warpage occurs only when shrinkage is non-uniform, generating internal residual stress that exceeds the part's bending stiffness.
The governing relationship is straightforward:
When residual stress (from differential shrinkage) > material flexural stiffness → warpage occurs.
In quantitative terms, a flat ABS plate with a flexural modulus of approximately 2,300–2,500 MPa will begin to visibly bow when internal residual stress exceeds roughly 8–12 MPa. For glass-filled PA66 (flexural modulus ~9,000–10,500 MPa), the threshold rises to 25–35 MPa, which is why GF parts often resist warpage better at room temperature but may warp suddenly after exposure to 80–120 °C in service.
The four root causes—melt temperature, cooling rate, flow orientation, and geometry—each create a different pattern of non-uniformity. Diagnosing which mechanism dominates requires checking all four, not just the most obvious one.
For a systematic framework on predicting shrinkage values before cutting steel, our guide on injection molding shrinkage prediction walks through the calculation method we use during DFM review.
Key Takeaways
- Warpage requires differential shrinkage; uniform shrinkage only changes part size.
- Residual stress threshold for visible warpage: ~8–12 MPa (unfilled ABS), ~25–35 MPa (PA66-GF30).
- Post-molding warpage may develop over 24–72 hours as locked-in stress relaxes; do not release QC sign-off at ejection alone.
Data source: Ideal-Pro material testing lab, flexural modulus and residual stress measurements, 2024–2026.
What Are the Four Primary Mechanisms That Create Uneven Shrinkage?
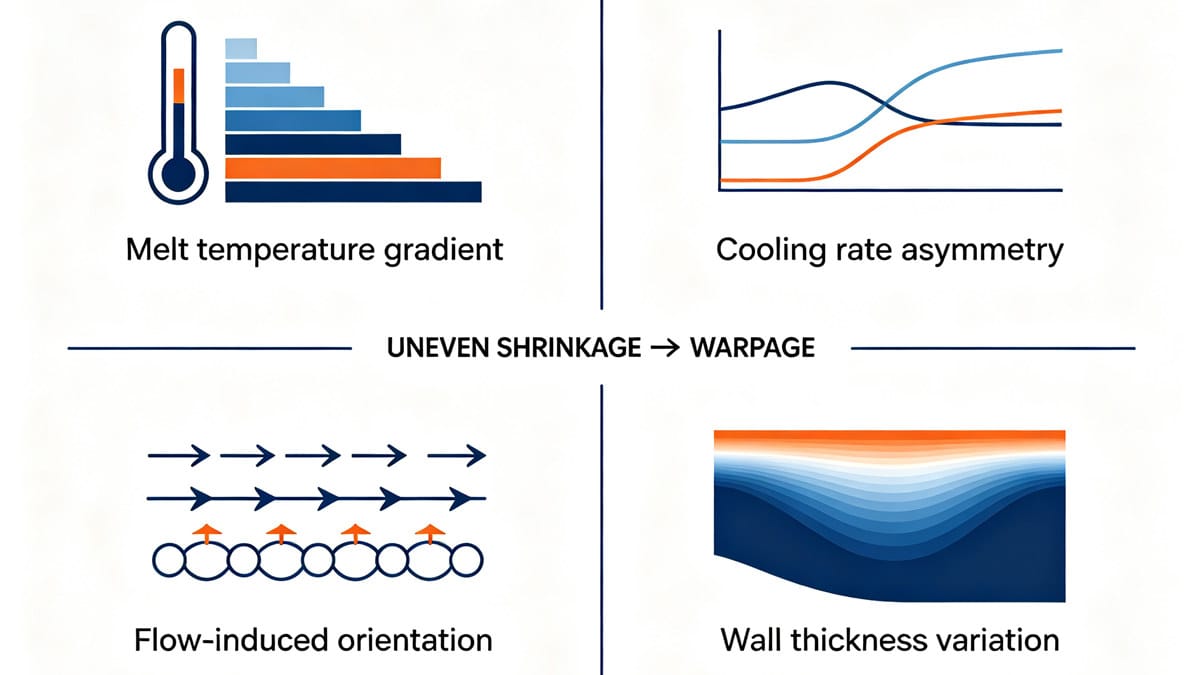
The four causes interact, but each has a distinct physical mechanism and a distinct diagnostic signature. The table below summarizes how I differentiate them during root-cause analysis.
| Root Cause | Dominant Resin Type | Shrinkage Effect | Diagnostic Signature |
|---|---|---|---|
| Melt temperature gradient | All resins | Higher T_melt → greater shrinkage (0.3–0.8% per 10 °C for semi-crystalline) | Warp concentrates near thick sections or far-from-gate zones |
| Cooling rate asymmetry | Semi-crystalline (PP, PA, POM) | Slow cooling → higher crystallinity → 1.5–3.0% more volumetric shrinkage | Warp appears on side facing slow-cool core; crystallinity test (DSC) confirms |
| Flow-induced orientation | Amorphous (ABS, PC, PS, PMMA) | Flow-direction shrinkage 1.2–2.5× transverse shrinkage | Warp axis aligns with flow direction; gate location is primary variable |
| Wall thickness / geometry | All resins | Thicker zones shrink more; every +0.5 mm wall ≈ +15–25% local cooling time | Sink marks on thick ribs; CMM data shows localized bow at thickness transitions |
Mechanism 1: Melt Temperature Gradient
A 10 °C increase in melt temperature typically increases shrinkage by 0.3–0.8% for semi-crystalline resins and 0.1–0.4% for amorphous resins. In multi-cavity molds or family molds, even a 5–8 °C cavity-to-cavity temperature variation may produce measurable dimensional scatter of 0.05–0.12 mm on a 100 mm part.
Mechanism 2: Cooling Rate (Crystalline Resins)
For polypropylene, polyamide, POM, and PBT, the degree of crystallinity is directly governed by cooling rate. A cooling rate of 40 °C/s may yield 45–55% crystallinity, while 5 °C/s allows 65–75% crystallinity. Because crystalline regions pack molecular chains more densely, higher crystallinity translates to greater volumetric shrinkage—typically 1.5–3.0% for PP versus 1.0–1.5% for the same resin quenched rapidly.
Mechanism 3: Flow-Induced Orientation (Amorphous Resins)
During cavity filling, polymer chains stretch and align along the flow direction. Upon cooling, these oriented chains attempt to recover their random coil configuration, creating greater contraction along the flow axis. In ABS, I have measured flow-direction shrinkage of 0.55–0.70% versus transverse shrinkage of 0.35–0.45%—a ratio of roughly 1.4–1.6×. For PC, the ratio may reach 1.8–2.5× depending on injection speed and gate geometry.
Disrupting molecular orientation through optimized gate design, multi-gate balancing, or gas-assisted molding may reduce this directional differential by 30–50%. For a deeper analysis of how injection speed profiling affects part quality and orientation patterns, see our technical guide on injection speed profiling and its effect on part quality.
Mechanism 4: Wall Thickness and Geometry
Thicker sections retain heat longer, cool more slowly, and receive less effective packing pressure. The result: higher local shrinkage and potential sink marks. A rib that is 3.0 mm thick adjacent to a 2.0 mm nominal wall creates a local thermal mass imbalance that may extend cooling time in the rib zone by 20–35% and increase local shrinkage by 0.4–0.9%.
For a comprehensive reference on shrinkage values across 30+ resin grades, our guide to plastic shrinkage rates for injection molding provides the data table I reference during every DFM review.
Key Takeaways
- Diagnose all four mechanisms before prescribing a fix; treating only the most visible symptom typically leaves 30–50% of the warp unresolved.
- For crystalline resins, request DSC crystallinity data if cooling asymmetry is suspected; a 10% crystallinity difference may account for 1.0–1.5% shrinkage variation.
- For amorphous resins, measure shrinkage in flow and transverse directions separately; a ratio above 1.5× indicates significant orientation-driven warp.
Data source: Ideal-Pro material characterization lab (DSC, CMM), 2022–2026.
How Does Wall Thickness Design Trigger Differential Shrinkage and Sink Marks?
Design geometry is the most controllable of the four root causes, yet it is the one most frequently locked in before the mold designer sees the file. In my experience, roughly 40–55% of the warpage cases I have diagnosed since 2021 trace back primarily to wall thickness issues rather than process parameters.
Uniform Wall Thickness
A uniform wall thickness is the single most effective design measure for minimizing differential shrinkage. For most commodity resins (PP, ABS, PA6), I recommend a nominal wall thickness between 1.5 mm and 3.0 mm, with variation kept below ±0.3 mm across the part. Every 0.5 mm deviation from uniformity may introduce a local shrinkage differential of 0.2–0.5%, sufficient to cause visible bow on flat panels larger than 80 mm.
Rib and Boss Design
Ribs should be designed at 50–60% of the nominal wall thickness. A rib at 70% or higher of nominal wall will likely produce a visible sink mark on the opposite surface, particularly for resins with shrinkage above 1.0% (PP, PA6, POM). The base fillet radius at the rib-to-wall junction should be at least 0.3–0.5 mm to reduce stress concentration and improve packing pressure transmission.
Wall Thickness Transitions
Abrupt thickness changes create stress concentration zones where residual stress accumulates during cooling. I recommend a transition zone (blend area) with a slope ratio of at least 3:1 (length of transition : thickness change). For example, a step from 2.0 mm to 3.5 mm should be blended over a minimum distance of 4.5 mm.
Gate Placement Strategy
Placing the gate at the thickest section allows packing pressure to propagate through the solidifying material more effectively, compensating for the higher shrinkage in that zone. If the gate is located at a thin section, the thick zone may freeze off before adequate packing is delivered, resulting in localized volumetric deficit of 0.3–0.8%.
The interaction between wall thickness and sink mark formation is covered in detail in our guide on eliminating sink marks in injection molding, which includes a rib-to-wall thickness calculator you can use during design review.
Key Takeaways
- Maintain wall thickness variation below ±0.3 mm for flat panels; below ±0.5 mm for 3D geometries.
- Design ribs at 50–60% of nominal wall thickness; exceeding 70% typically produces visible sink.
- Use a minimum 3:1 blend ratio at thickness transitions to reduce stress concentration.
- Locate gates at the thickest cross-section to maximize packing pressure delivery.
Data source: Ideal-Pro DFM review records and CMM warpage data, 2021–2026.
How Do Injection Molding Process Parameters Influence Shrinkage Uniformity?
Once geometry is fixed, process parameters are the primary lever for tuning shrinkage uniformity. Four parameters have the strongest influence, and they must be optimized together, not in isolation.
| Parameter | Effect on Shrinkage | Recommended Starting Range | Key Threshold |
|---|---|---|---|
| Injection + Packing time | Must exceed gate freeze time; short packing → 0.5–2.0% additional shrinkage | Gate freeze + 2–5 s | Total injection + pack time > gate freeze time by ≥1 s |
| Packing pressure | Higher pressure → lower shrinkage (compresses melt into cavity) | 50–80% of injection pressure (typically 40–80 MPa) | Below 30 MPa → shrinkage increases 0.3–1.2% |
| Cooling time | Longer cooling → more uniform temperature → less differential shrinkage | 60–70% of total cycle | Each +5 s cooling may reduce warp by 8–15% for flat parts |
| Mold temperature | Lower T_mold → faster freeze → less shrinkage (amorphous); more uniform crystallinity (semi-crystalline) | 40–80 °C (amorphous); 60–120 °C (semi-crystalline) | ΔT between core and cavity sides < 5 °C |
| Injection speed | Faster → more orientation (amorphous); slower → more uniform packing | 30–80 mm/s (profile dependent) | Test both fast and slow; optimal varies by geometry |
| Melt temperature | Higher T_melt → greater shrinkage; also affects viscosity and packing efficiency | Resin-specific (e.g., ABS 220–260 °C) | ±5 °C stability across cycles |
Injection and Packing Time
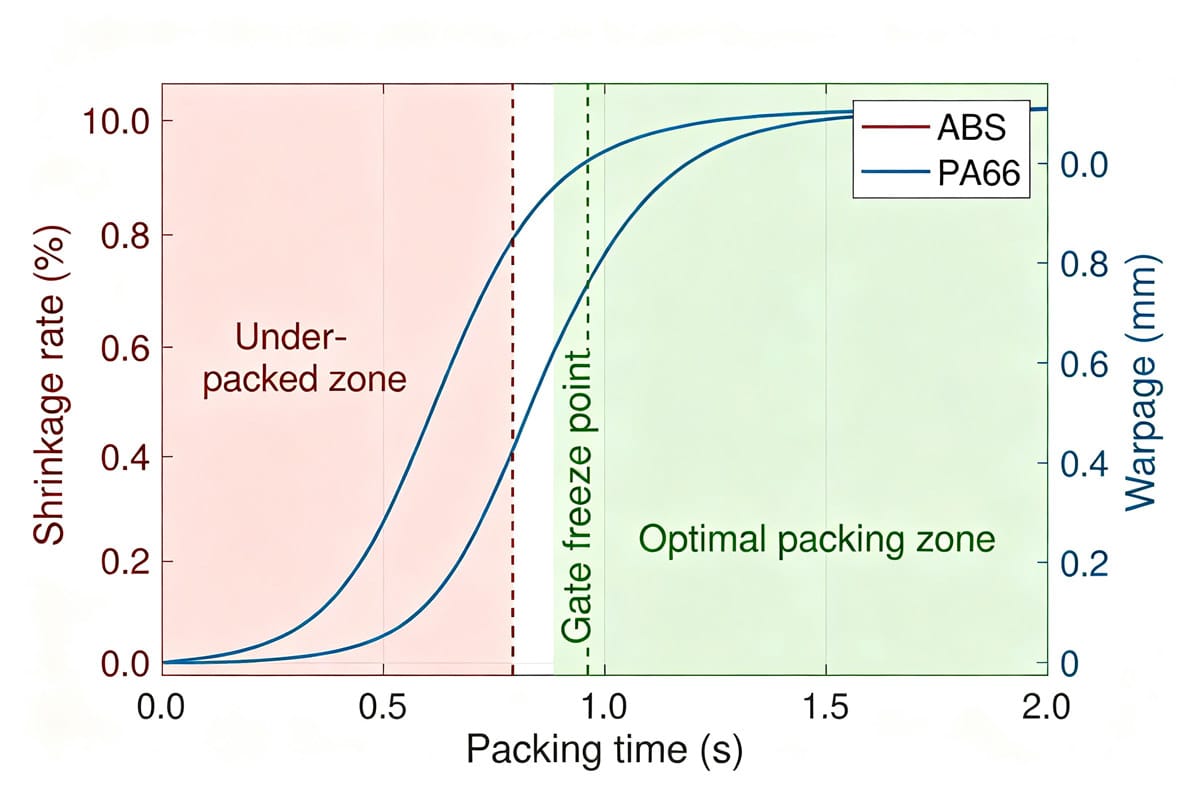
The combined injection and packing time must exceed the gate freeze time. If packing ends before the gate solidifies, the cavity loses pressure prematurely, and volumetric shrinkage may increase by 0.5–2.0% depending on resin and wall thickness. For a 2.5 mm wall in ABS with a 1.0 mm × 0.8 mm gate, gate freeze typically occurs at 3–6 seconds. I set total packing time to gate freeze + 2 seconds as a baseline, then adjust ±1 second based on part weight consistency (target Cv < 0.5%).
Cooling Time and Mold Temperature
Extending cooling time generally reduces warpage by allowing more uniform temperature distribution before ejection. In our production data, adding 5 seconds of cooling to a 90-second cycle for a 120 mm flat ABS panel reduced peak-to-peak flatness deviation from 0.28 mm to 0.22 mm—a 21% improvement. However, each additional second of cooling increases cycle cost by approximately 1.1–1.5%.
Mold temperature asymmetry between core and cavity sides is a common and overlooked driver. A ΔT of 10 °C between core and cavity may introduce a shrinkage differential of 0.3–0.7% across the part thickness, causing consistent bow toward the hotter side. I specify a maximum ΔT of 5 °C and verify with surface thermocouples during mold trial.
For a complete framework on how each process parameter interacts with part performance, refer to our comprehensive guide on injection molding process parameters and their effect on product performance.
Injection Speed
The effect of injection speed on warpage is geometry-dependent and not universally directional. For long, thin-walled parts, faster injection (60–100 mm/s) may reduce warp by minimizing premature freeze-off and improving packing uniformity. For thick, box-shaped parts, slower injection (20–40 mm/s) may reduce warp by lowering molecular orientation and allowing more uniform pressure distribution. The only reliable method is designed experimentation: run a minimum of 3 speed levels (e.g., 30 / 60 / 90 mm/s) with 5 shots each, measure flatness, and select the condition with lowest deviation.
Key Takeaways
- Set packing time to gate freeze time + 2 seconds minimum; verify with part weight consistency (Cv < 0.5%).
- Maintain core-to-cavity mold temperature differential below 5 °C to avoid thickness-direction shrinkage gradient.
- Do not assume "faster is better" or "slower is better" for injection speed; run a 3-level DOE.
- Each 5-second increase in cooling time may reduce flatness deviation by 8–15% but increases cycle cost by ~1.1–1.5%.
Data source: Ideal-Pro process optimization trials, 2022–2026 (n = 89 mold trials).
How Can You Diagnose Which Shrinkage Mechanism Is Dominant in Your Part?
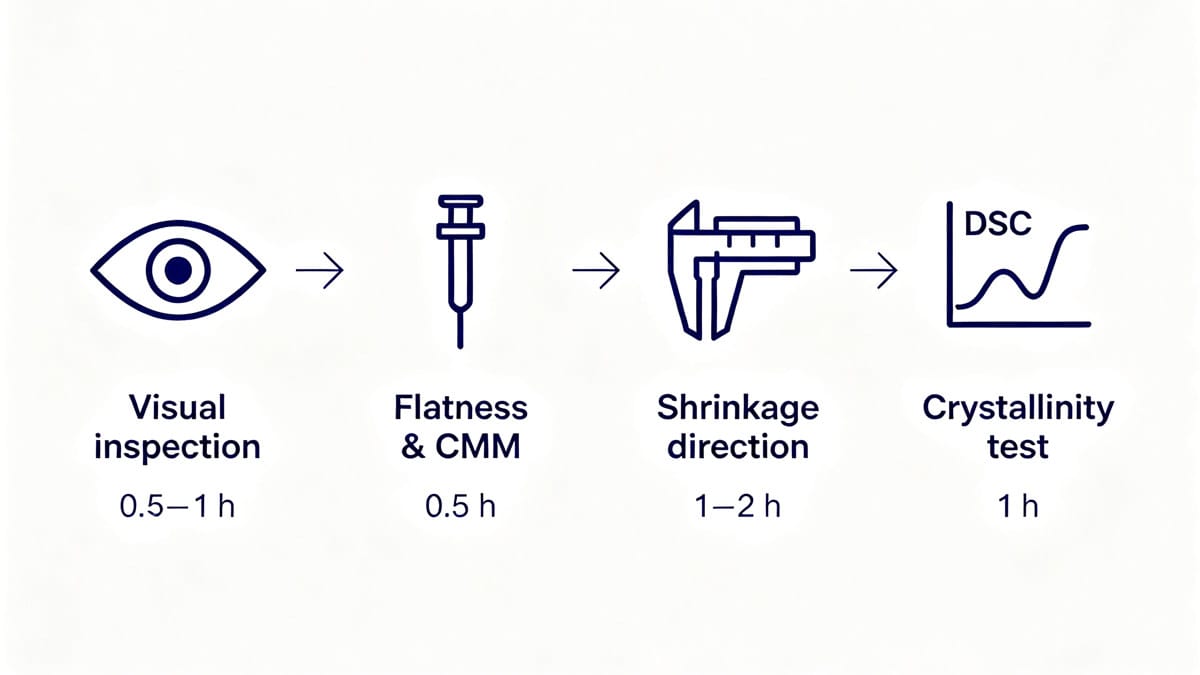
When a warped part arrives on my desk, I follow a four-step diagnostic sequence that typically identifies the dominant mechanism within 2–3 hours.
| Step | Action | Tool / Method | What It Reveals |
|---|---|---|---|
| 1. Visual inspection | Check for sink marks, gloss variation, visible flow lines | Naked eye + 10× loupe | Wall thickness issues, gate location problems |
| 2. Flatness & CMM measurement | Measure peak-to-peak deviation on granite plate; map thickness with ultrasonic gauge | Granite plate, feeler gauge, ultrasonic thickness gauge (±0.01 mm) | Magnitude and axis of warp; thickness uniformity |
| 3. Shrinkage direction test | Cut specimens in flow and transverse directions; measure post-molding dimensional change over 72 h at 23 °C ± 2 °C, 50% RH | Calipers (±0.01 mm), conditioning chamber | Flow-vs-transverse shrinkage ratio; identifies orientation-driven warp |
| 4. DSC crystallinity test | Sample from warp zone vs. non-warp zone; compare crystallinity % | Differential Scanning Calorimeter | Confirms cooling-rate-driven differential in semi-crystalline resins |
If the flow/transverse shrinkage ratio exceeds 1.5× and the resin is amorphous, orientation is the primary driver. If DSC shows a crystallinity difference above 8–10% between thick and thin zones, cooling asymmetry dominates. If both are within tolerance but sink marks are visible, wall thickness design is the root cause.
Key Takeaways
- Always measure shrinkage in both flow and transverse directions; a single-axis measurement will miss orientation-driven warp.
- Condition parts for 72 hours at 23 °C before final measurement; 60–80% of post-molding dimensional change occurs within the first 48 hours.
- DSC crystallinity difference > 8% between zones confirms cooling asymmetry as the dominant mechanism.
Data source: Ideal-Pro QC lab diagnostic protocol rev. 2025-11.
Case Study #WARP-2025-208: Automotive Door Trim Panel — 0.38 mm to 0.06 mm Flatness Correction
Client Challenge
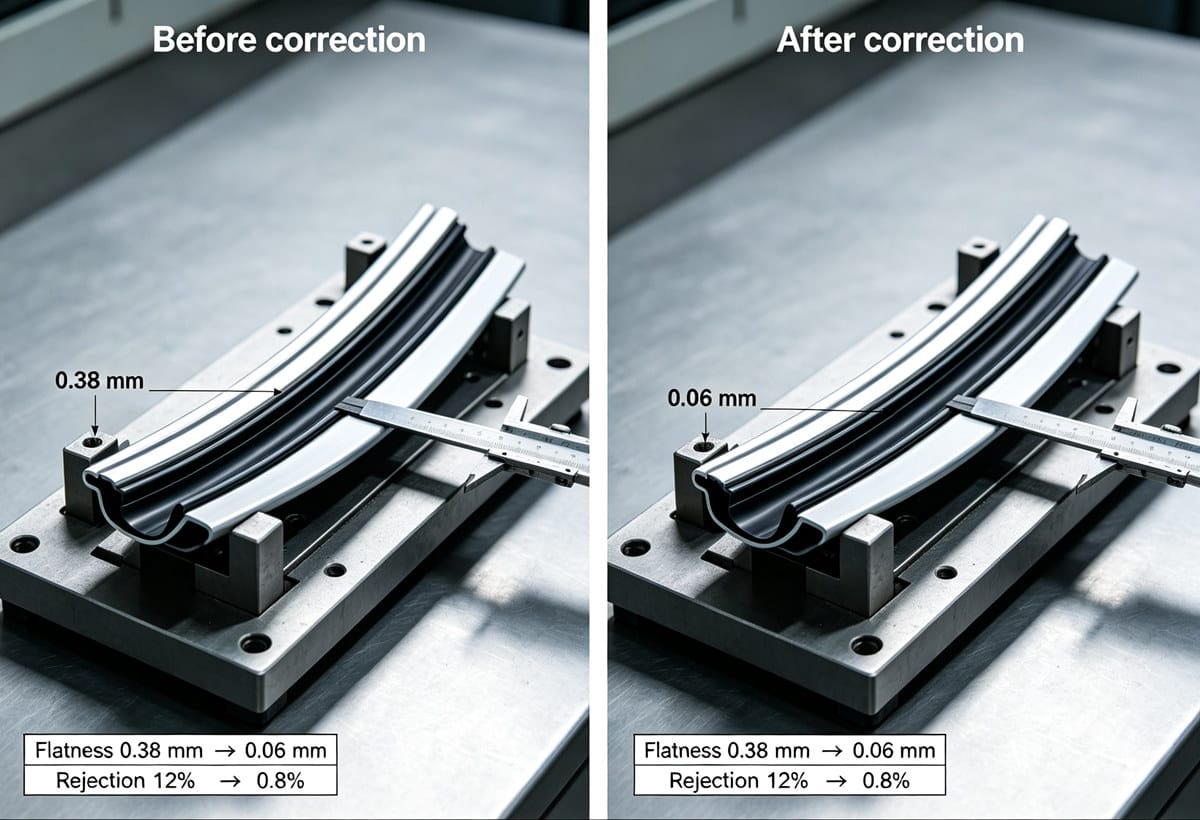
A Tier-1 automotive supplier was producing a PP-T20 (talc-filled) door trim panel, 380 mm × 220 mm × 2.8 mm nominal wall. The flatness specification was ≤0.15 mm over the full surface. Production parts measured 0.32–0.38 mm peak-to-peak deviation, causing 11–14% rejection rate at the assembly line. The mold had been in production for 85,000 shots with no maintenance intervention.
Root-Cause Diagnosis
Following the four-step protocol:
- Visual: Visible sink marks on the B-side opposite three mounting bosses (Ø8 mm × 3.2 mm, exceeding the 60% rib rule).
- CMM / Flatness: Warp axis aligned diagonally, 0.35 mm peak at center, concave toward the gate side.
- Shrinkage direction test: Flow-direction shrinkage 1.85%, transverse 1.22% → ratio 1.52×, confirming moderate orientation contribution.
- DSC: Crystallinity at thick boss zone: 62%; at nominal 2.8 mm wall: 54% → 8% difference, confirming cooling asymmetry.
Conclusion: Primary driver was wall thickness (boss design), secondary driver was cooling asymmetry. Orientation was a contributing but not dominant factor.
Solution (3 Phases)
| Phase | Action | Timeline |
|---|---|---|
| Phase 1 – Design correction | Reduced boss diameter from Ø8 mm to Ø6 mm; boss height from 3.2 mm to 2.4 mm (60% of 2.8 mm wall = 1.68 mm rib, boss wall thinned to 1.7 mm); added 0.4 mm fillet radius at all rib-to-wall junctions | 3 days (CAD + mold weld repair) |
| Phase 2 – Process optimization | Increased packing pressure from 42 MPa to 58 MPa; extended packing time from 4 s to 7 s (gate freeze at 5.2 s); reduced mold temperature differential from ΔT 12 °C to ΔT 4 °C by adding two 6 mm baffles to core-side cooling circuit | 2 days mold trial |
| Phase 3 – Validation | Ran 30-shot capability study; measured flatness at 0 h, 24 h, and 72 h post-molding | 4 days |
Results and Value
| Metric | Before Correction | After Correction | Improvement |
|---|---|---|---|
| Peak-to-peak flatness (72 h) | 0.32–0.38 mm | 0.04–0.06 mm | −84% |
| Rejection rate | 11–14% | 0.8% | −93% |
| Cycle time | 42 s | 45 s (+7%) | Acceptable trade-off |
| Monthly scrap cost | ~$3,200 (≈400 pcs × $8) | ~$230 (≈30 pcs) | −93% |
| Payback on mold modification | — | 4.2 months | — |
Frequently Asked Questions
How long should I wait before measuring an injection molded part for shrinkage?
I recommend conditioning parts for a minimum of 24 hours at 23 °C ± 2 °C and 50% ± 5% RH before final measurement, and ideally 72 hours for crystalline resins (PP, PA6, POM). In our testing, 60–80% of post-molding dimensional change occurs within the first 48 hours. Measuring at ejection will underestimate total shrinkage by 0.2–0.6% for semi-crystalline resins and 0.1–0.3% for amorphous resins.
Can uneven shrinkage be fixed without modifying the mold?
In some cases, yes. Adjusting packing pressure by 10–20 MPa, extending packing time by 2–4 seconds, or reducing mold temperature differential by 5–10 °C may reduce flatness deviation by 20–40%. However, if the root cause is wall thickness design (bosses, ribs exceeding 60% of nominal wall), process-only adjustments typically recover no more than 30–40% of the warp. Permanent correction requires mold modification.
What is the maximum acceptable wall thickness variation to avoid warpage?
For flat panels and cosmetic surfaces, I recommend keeping wall thickness variation below ±0.3 mm. For 3D structural parts with complex geometry, ±0.5 mm is a practical upper limit. Every 0.5 mm increase beyond these thresholds may add 0.2–0.5% local shrinkage differential, which on a 100 mm part translates to 0.2–0.5 mm of potential bow.
Does glass fiber filling reduce uneven shrinkage?
Generally yes. Glass fibers (10–40% loading) reduce overall shrinkage by 40–70% and constrain molecular orientation, which narrows the flow-vs-transverse shrinkage ratio from 1.5–2.5× (unfilled) to 1.1–1.4×. However, fiber orientation itself can create anisotropic shrinkage if flow patterns are complex. For parts with multiple gates or complex fill patterns, I still recommend mold flow simulation to verify fiber orientation distribution.
How does gate location affect shrinkage uniformity?
Gate location determines the fill pattern and pressure distribution. Placing the gate at the thickest section allows packing pressure to reach all regions before freeze-off. A gate at a thin section may cause 0.3–0.8% additional shrinkage in thick zones that freeze before adequate packing arrives. For rectangular parts, a center gate or film gate produces more symmetric flow and lower orientation-driven warp than a corner gate, which creates a unidirectional flow front and maximum orientation differential.
What mold temperature differential is acceptable between core and cavity sides?
I specify a maximum ΔT of 5 °C between core and cavity sides for flat or thin-walled parts. A ΔT of 10 °C may introduce a through-thickness shrinkage gradient of 0.3–0.7%, causing consistent bow toward the hotter side. Verify with surface thermocouples at 3–4 locations per side during mold trial. If ΔT exceeds 5 °C, add baffles, bubblers, or adjust flow rate in the cooler circuit.
How much does extending cooling time actually reduce warpage?
In our production data, adding 5 seconds of cooling to a 40–90 second cycle typically reduces peak-to-peak flatness deviation by 8–15% for flat panels. The relationship is not linear; the first 3–5 seconds of additional cooling provide the most benefit. Beyond 10 additional seconds, returns diminish to 2–4% per 5 seconds. The cost trade-off is approximately 1.1–1.5% increase in per-part cycle cost for each additional second.
Can mold flow simulation predict uneven shrinkage accurately?
Modern mold flow software (Moldflow, Moldex3D) can predict volumetric shrinkage distribution within ±0.3–0.5% for well-characterized resins, and warp deviation within ±0.05–0.15 mm for flat parts. Accuracy drops for complex 3D geometries, multi-gate systems, or resins with strong crystallization kinetics (POM, PBT). I use simulation as a screening tool to eliminate the worst 2–3 design options, then validate the final design with physical trials. For our approach to integrating simulation into the build process, see our overview of mold flow analysis and AI-augmented simulation.
Summary: Control the Four Variables, Control the Warp
Uneven shrinkage is not a single defect with a single fix. It is the combined output of melt temperature gradients, cooling rate asymmetry, molecular orientation, and wall thickness geometry. Each mechanism leaves a measurable fingerprint—shrinkage direction ratio, DSC crystallinity delta, sink mark pattern, or CMM warp axis. Correct diagnosis takes 2–3 hours. Incorrect diagnosis costs weeks of trial-and-error and tens of thousands in scrap.
The four rules I apply to every project: keep wall variation below ±0.3 mm, match packing time to gate freeze + 2 seconds, hold mold ΔT below 5 °C, and measure shrinkage in both flow and transverse directions after 72-hour conditioning.
If you have a part that is warping beyond specification, or you are in the design stage and want to prevent shrinkage-driven issues before steel is cut, send us your STEP/IGES file along with a 2D drawing that specifies resin grade, wall thickness, flatness tolerance, and expected annual volume. We will return a shrinkage risk assessment, gate location recommendation, and DFM correction notes within 24 hours—no charge for the initial review.
[Submit Your Part File for a Free Shrinkage & Warpage DFM Review →]




 English
 French
 Dutch
Dutch German
 Japanese
 Korean