

Introduction
Plastic products have become an indispensable part of modern life, and the demand for higher quality continues to grow. Injection molding remains the most widely used manufacturing process for producing plastic parts at scale. However, the quality of injection-molded parts is governed by numerous factors, among which process parameters are arguably the most critical.
Traditionally, mold design and process parameter settings relied heavily on the experience and intuition of engineers. Trial-and-error approaches—repeated mold trials and adjustments—led to long development cycles, high costs, and inconsistent quality.
Today, with the advancement of CAE simulation software (such as Moldflow, Moldex3D, and Sigmasoft), engineers can predict melt flow behavior, identify potential defects, and optimize process parameters before cutting steel. This shift from experience-based to science-based manufacturing has dramatically improved efficiency and product quality.
Key Insight: Precision machinery, well-designed molds, and high-quality materials can only deliver their full potential when paired with properly optimized process settings. Conversely, certain deficiencies in equipment or mold design can sometimes be compensated by fine-tuning process parameters.
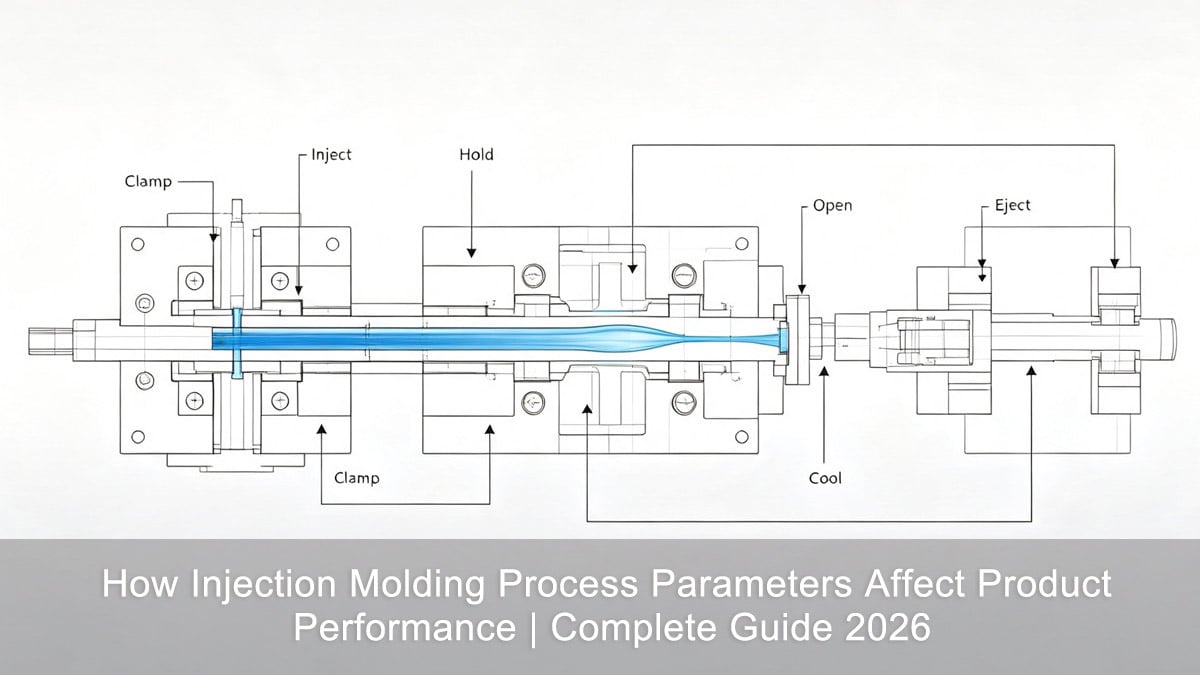
Why Process Parameters Are the Decisive Factor
The process parameters directly determine the flow state of the melt inside the mold cavity, which in turn dictates:
- Dimensional accuracy and shrinkage
- Mechanical properties (tensile strength, impact resistance, flexural modulus)
- Surface quality (gloss, roughness, weld lines)
- Internal stress distribution
- Crystallinity (for semi-crystalline polymers)
Finding the optimal process window and implementing robust process control is the most effective pathway to producing high-quality plastic parts.
Key Injection Molding Process Parameters and Their Effects
1. Injection Pressure
Definition: Injection pressure is the force exerted by the screw tip (or plunger) on the plastic melt during the injection phase.
Functions:
| Function | Description |
|---|---|
| Overcoming flow resistance | Pushes melt through the barrel, nozzle, runner, and gate |
| Cavity filling | Ensures the melt fills the mold at a controlled velocity |
| Compaction | Packs the cavity to compensate for volumetric shrinkage during cooling |
Factors influencing required injection pressure:
- Polymer type and viscosity
- Injection machine type and capacity
- Mold temperature
- Part wall thickness
- Runner and gate geometry (critical factor)
Impact on product quality:
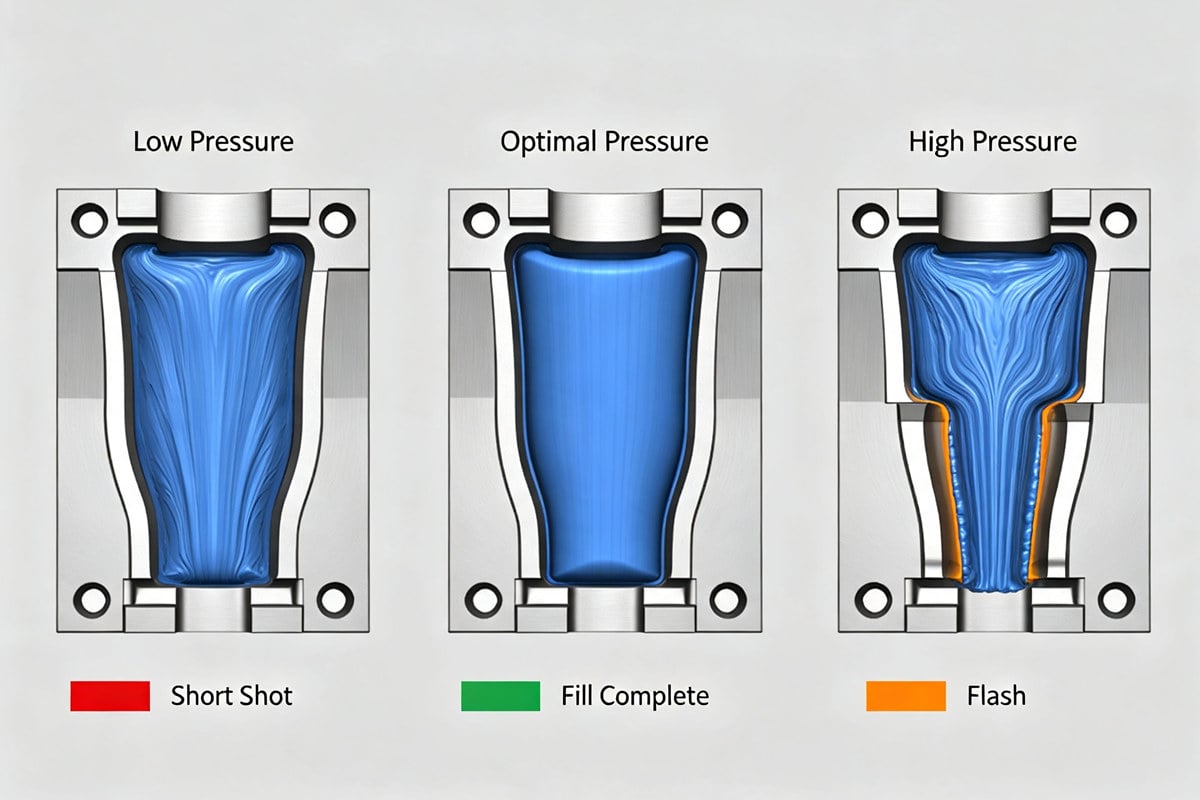
| Injection Pressure Level | Positive Effects | Negative Effects |
|---|---|---|
| Too Low | — | Short shots, sink marks, poor surface replication |
| Optimal | Dense packing, accurate dimensions, good mechanical properties | — |
| Too High | — | Flash, high residual stress, mold damage, ejection difficulty |
2. Holding (Packing) Pressure
After the cavity is filled, the injection pressure transitions into holding pressure, which serves to:
- Compact the melt to minimize shrinkage
- Feed additional material into the cavity as the part cools and contracts
- Stabilize part dimensions
Best Practices:
- Holding pressure is typically set at 50%–80% of the injection pressure for most thermoplastics.
- Equal holding and injection pressure can minimize shrinkage and improve dimensional stability but may increase residual stress, causing ejection difficulty, warpage, or surface scratches.
- Always consider material characteristics, part geometry, and gate freeze time when setting holding pressure.
| Parameter | Effect on Part Quality |
|---|---|
| Holding Pressure ↑ | Lower shrinkage, better dimensional stability, higher density |
| Holding Pressure too high | Increased residual stress, flash, ejection marks, warpage |
| Holding Pressure too low | Sink marks, voids, poor dimensional control |
3. Plasticizing Pressure (Back Pressure)
Definition: Back pressure is the resistance force acting on the screw during its retraction (recovery) phase.
Effects:
| Back Pressure Level | Plastification Quality | Potential Issues |
|---|---|---|
| Increased | Better mixing, more uniform melt temperature, improved color dispersion | Reduced output, higher shear heat |
| Too High | — | Material degradation, bubbles, burn marks, metering inaccuracy |
| Too Low | Inconsistent melt, unmelted particles | Silver streaks, weak spots |
⚠️ Caution: Excessive back pressure increases shear stress and shear heat, potentially causing polymer degradation—especially for heat-sensitive materials like PVC or POM.
4. Mold Temperature
Mold temperature is one of the most influential parameters, affecting:
- Melt flow behavior during filling
- Cooling rate and crystallization
- Residual stress and warpage
- Surface finish and aesthetic quality
Guidelines by Material Type:
| Material Category | Recommended Mold Temp. | Rationale |
|---|---|---|
| Low-viscosity amorphous (e.g., PS, PC) | 40–80°C | Shorter cycle time, adequate surface quality |
| High-viscosity amorphous (e.g., PC/ABS) | 70–110°C | Better flow, reduced internal stress |
| Semi-crystalline (e.g., PA, POM, PBT) | 80–120°C | Controlled crystallization, improved mechanical properties |
| High-performance (e.g., PEEK, PPS) | 150–200°C | Ensure proper crystallinity and dimensional stability |
Key Relationships:
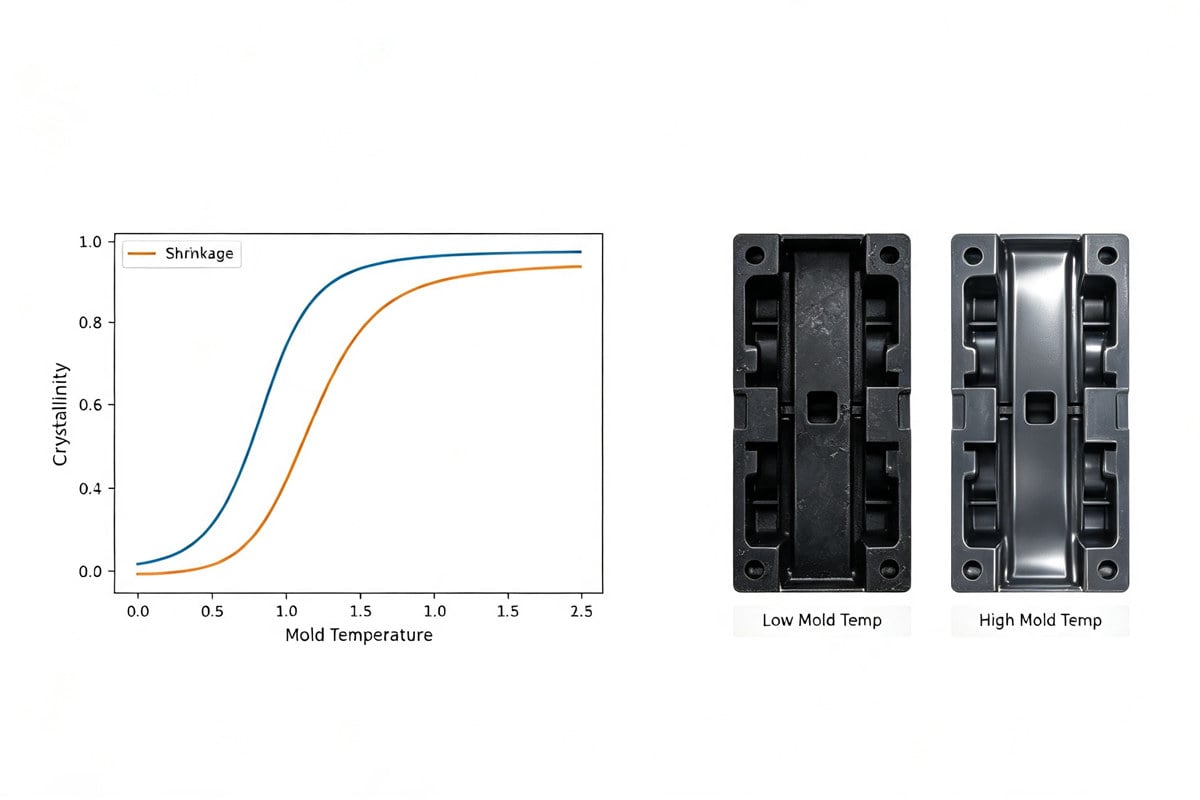
- Higher mold temperature → slower cooling → higher crystallinity → better mechanical properties but longer cycle time; risk of brittleness if excessive.
- Lower mold temperature → faster cooling → lower crystallinity → potential for short shots, high orientation, weld line weakness, and sink marks.
5. Barrel Temperature
Barrel temperature ensures proper melting and flow without thermal degradation.
General Principles:
- Set in a front-high, rear-low gradient (i.e., nozzle zone > compression zone > feed zone).
- Higher molecular weight or glass-fiber-reinforced grades require higher barrel temperatures.
- If material contains excess moisture, slightly raising the rear zone temperature can aid venting.
| Zone | Typical Function | Temperature Trend |
|---|---|---|
| Feed Zone | Convey and preheat | Lowest |
| Compression Zone | Melt and compress | Medium |
| Metering Zone | Homogenize and meter | Highest |
| Nozzle | Final temperature adjustment | Slightly below max barrel temp |
6. Nozzle Temperature
- Typically set 5–10°C lower than the maximum barrel temperature to prevent drooling (salivation).
- Verification method: Perform a low-speed air shot. If the extrudate is smooth, glossy, and bubble-free, the temperature is appropriate.
- Too low → cold slug, flow marks, increased pressure drop.
- Too high → drooling, stringing, material degradation at the gate.
7. Melt Temperature
Melt temperature is the actual temperature of the polymer as it enters the mold, determined by barrel and nozzle settings plus shear heating.
Effects of Increasing Melt Temperature:
| Property | Trend with Higher Melt Temp |
|---|---|
| Flow length | ↑ Increases |
| Weld line strength | ↑ Improves |
| Surface roughness | ↓ Improves (smoother) |
| Post-molding shrinkage | ↓ Decreases |
| Orientation | ↓ Decreases |
| Tensile strength (flow direction) | ↓ Slightly decreases |
| Impact strength (flow direction) | ↓ Decreases |
| Impact strength (transverse) | ↑ Increases |
| Internal stress | ↓ Decreases |
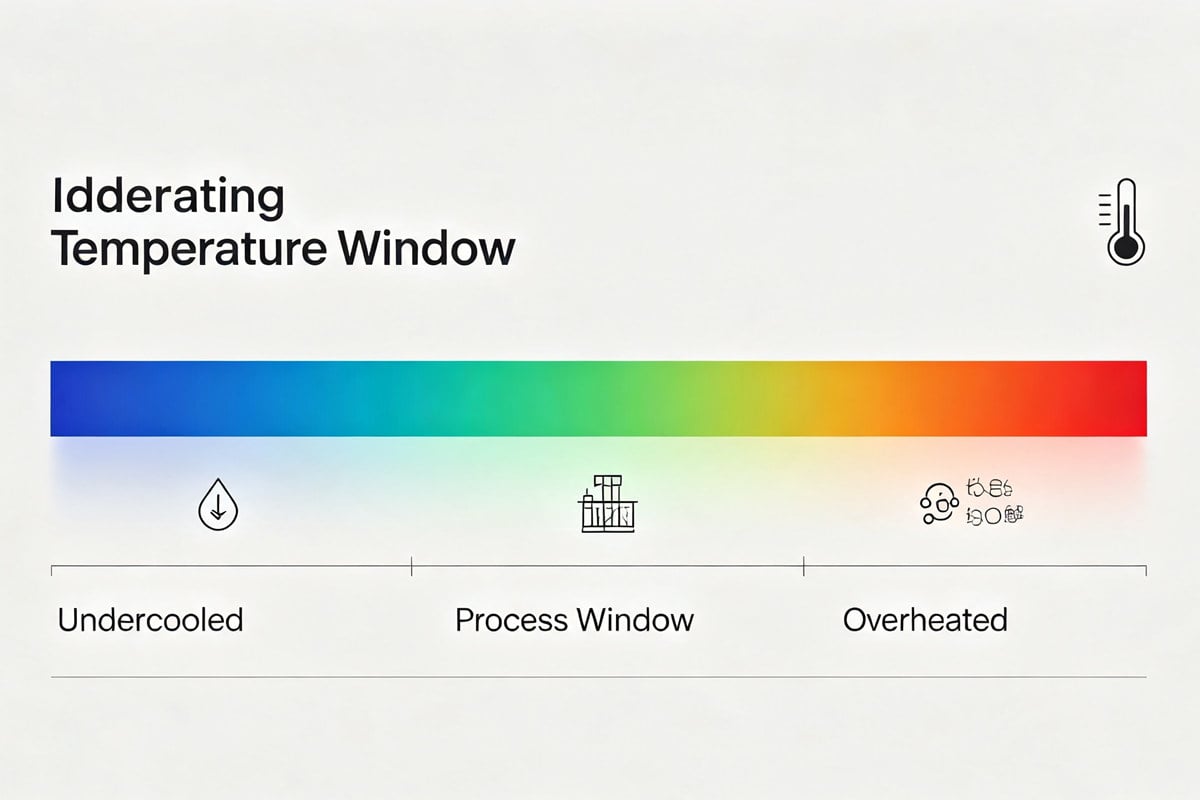
⚠️ Upper Limit Warning: When melt temperature approaches the upper boundary of the processing window:
- Gas generation → bubbles, voids, discoloration, burn marks
- Excessive fluidity → flash
- Polymer degradation → loss of strength and elasticity
8. Injection Time & Speed
Injection time is inversely related to injection speed (rate). It is one of the most sensitive parameters affecting part quality.
| Injection Speed | Advantages | Risks |
|---|---|---|
| High (short time) | Higher packing pressure, uniform cavity temp, lower shrinkage, stronger weld lines, reduced core orientation | Increased pressure loss, higher surface orientation, elastic turbulence, flash, surface cracks |
| Low (long time) | Lower shear, less orientation at surface | Weak weld lines, higher overall orientation, increased internal stress, flow marks |
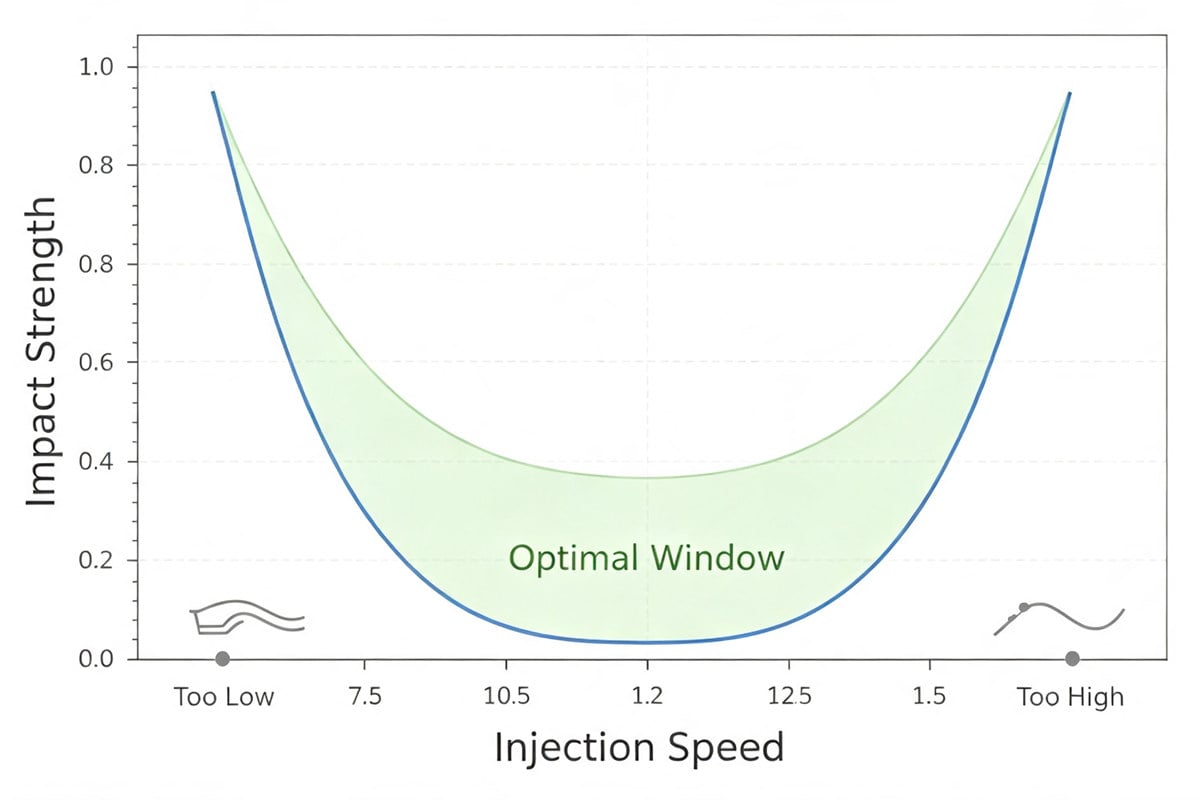
📊 Experimental finding: Both excessively high and excessively low injection speeds lead to reduced impact strength. An optimal mid-range speed typically delivers the best balance of properties.
9. Holding Time & Cooling Time
| Parameter | Too Short | Optimal | Too Long |
|---|---|---|---|
| Holding Time | Sink marks, voids, dimensional instability, backflow | Dense, dimensionally stable parts | Increased residual stress, ejection difficulty, top-out marks |
| Cooling Time | Part deformation on ejection, dimensional instability | Proper solidification, stable dimensions | Reduced productivity, possible over-cooling brittleness |
| Plasticizing Time | Incomplete melting, hard lumps, silver streaks | Uniform melt | Thermal degradation, burn marks |
10. Special Process Technologies
Beyond conventional parameter optimization, advanced techniques can further enhance part performance:
| Technology | Mechanism | Benefits |
|---|---|---|
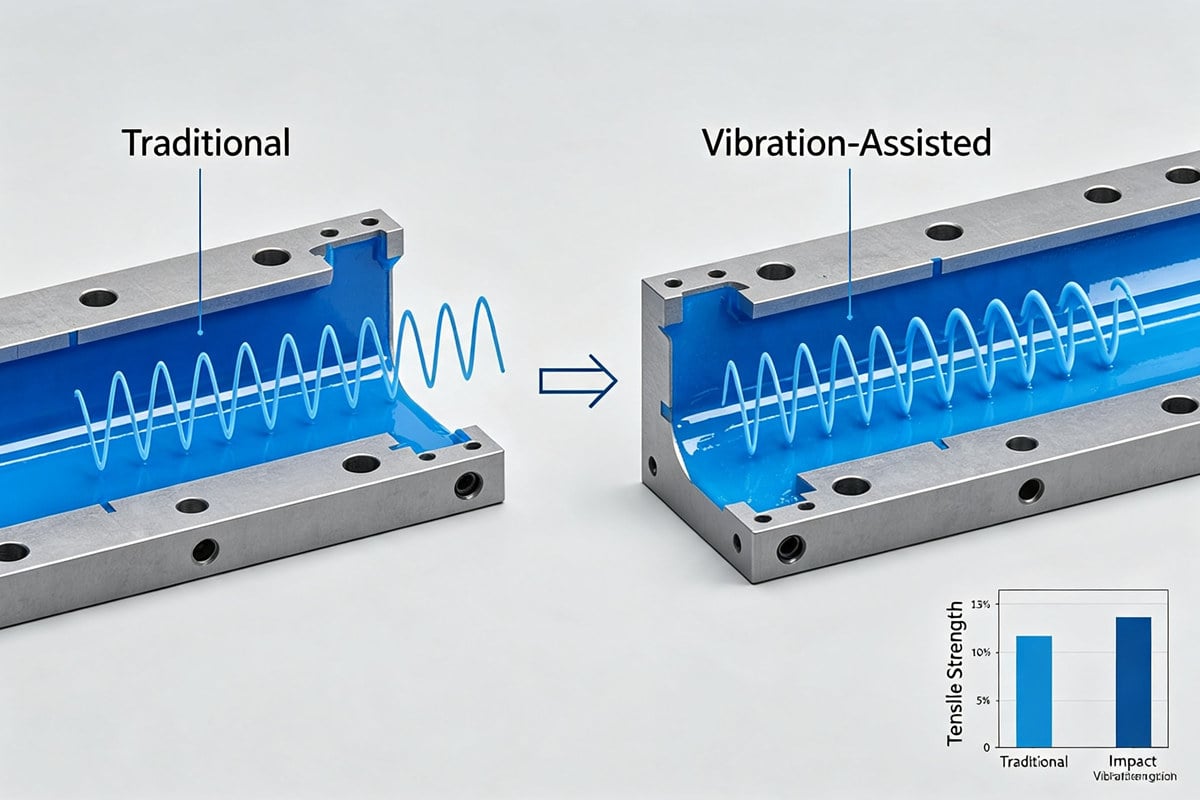
| Vibration-assisted injection molding | Applies oscillatory pressure during packing | ↑ Tensile strength, ↑ notched impact strength (improves with frequency) |
| Ultrasonic-assisted molding | High-frequency vibration reduces melt viscosity | Better flow, reduced residual stress, improved weld line strength |
| Gas-assisted injection molding | Inert gas creates hollow channels | Reduced weight, less sink, lower clamp force |
| Rapid heat cycle molding (RHCM) | Dynamic mold heating/cooling | Elimination of weld lines, improved surface gloss |
Comprehensive Parameter–Effect Summary Table
The following table provides a quick-reference overview of how each parameter influences key quality attributes:
| Process Parameter | Shrinkage | Mechanical Strength | Surface Quality | Internal Stress | Cycle Time |
|---|---|---|---|---|---|
| Injection Pressure ↑ | ↓ | ↑ | ↑ (to a point) | ↑ | — |
| Holding Pressure ↑ | ↓ | ↑ | ↑ | ↑ | — |
| Mold Temperature ↑ | ↑ (crystalline) / ↓ (amorphous) | ↑ (crystalline) | ↑ | ↓ | ↑ |
| Melt Temperature ↑ | ↓ | ↓ (flow dir.) / ↑ (transverse) | ↑ | ↓ | — |
| Injection Speed ↑ | ↓ | ↑ (weld line) | ↑ (to a point) | Variable | ↓ |
| Holding Time ↑ | ↓ | ↑ | ↑ | ↑ | ↑ |
| Back Pressure ↑ | — | ↑ (uniformity) | ↑ | — | ↑ |
Legend: ↑ = increases/improves | ↓ = decreases/reduces | — = minimal direct effect
Conclusion
Injection molding process parameters do not act in isolation—they form a highly interconnected system. A defect observed in the final product is often the combined result of multiple parameter interactions. For example:
- Sink marks may result from insufficient holding pressure combined with inadequate cooling time.
- Warpage may stem from uneven mold temperature combined with high residual stress from excessive injection speed.
Best practices for process optimization:
- Use DOE (Design of Experiments) to systematically explore parameter interactions.
- Leverage CAE simulation to predict flow, packing, cooling, and warpage before mold fabrication.
- Implement SPC (Statistical Process Control) for production consistency.
- Document the process window for each material–mold combination.
By understanding and controlling each parameter—and their interactions—manufacturers can achieve consistent, high-quality production while minimizing waste and cycle time.
Frequently Asked Questions (FAQ)
Q1: What is the most critical injection molding parameter? A: There is no single "most critical" parameter. However, mold temperature and holding pressure are often considered the most influential on final part quality because they directly govern shrinkage, crystallinity, and residual stress.
Q2: How does injection speed affect weld line strength? A: Higher injection speed generally improves weld line strength by keeping the melt front at a higher temperature when the flow fronts merge. However, excessively high speed can cause turbulence and surface defects.
Q3: What happens if mold temperature is too low? A: Low mold temperature causes rapid cooling, leading to incomplete crystallization (for semi-crystalline materials), high orientation, poor surface replication, short shots, and weak weld lines.
Q4: Can process parameters compensate for poor mold design? A: To some extent, yes. For example, increasing melt temperature and injection pressure can help fill thin sections. However, fundamental design flaws (e.g., inadequate venting, unbalanced runners) cannot be fully corrected by process adjustments alone.
Q5: What is the recommended holding pressure as a percentage of injection pressure? A: For most thermoplastics, holding pressure is typically set between 50% and 80% of the injection pressure, depending on material, part geometry, and gate design.


 English
 French
 Dutch
Dutch German
 Japanese
 Korean